Bitcoin’s BTC Rally is a Picture Perfect Advance So Far Bollinger

Bitcoin’s (BTC) Rally is a Picture Perfect Advance So Far – Bollinger

John P. Njui • BITCOIN (BTC) NEWS • August 18, 2020
In brief:
- According to John Bollinger, Bitcoin’s current rally is a picture-perfect advance.
- BTC has broken the $12k ceiling and managed to turn it into a support zone.
- $13,000 could be in sight if Bitcoin’s momentum is maintained.
The inventor of the popular charting tool/indicator of Bollinger Bands, John Bollinger, has stated that Bitcoin’s current rally is a picture-perfect advance so far. Mr. Bollinger made the comments via Twitter and added that the move by Bitcoin above $12k followed a textbook path within its Bollinger Bands.
His comments were as follows.
I imagine that someone is complaining about the $BTCUSD rally. Not me, a picture perfect advance so far.
Squeeze, confirmed break out, walk up the upper band, consol, support at middle band, mini-Squeeze, break to new highs. How much more could one ask for?!
$13k Could Be In Sight for Bitcoin
Prior to Bitcoin (BTC) breaking $12k, the King of Crypto had printed an ascending triangle. By breaking the $12k ceiling, Bitcoin has set itself on a path to test the 2019 peak value of $14,000.
However, before Bitcoin traders can look forward to a retest of the $14k price level, BTC has to go through another difficult zone between $12,900 and $13,100.
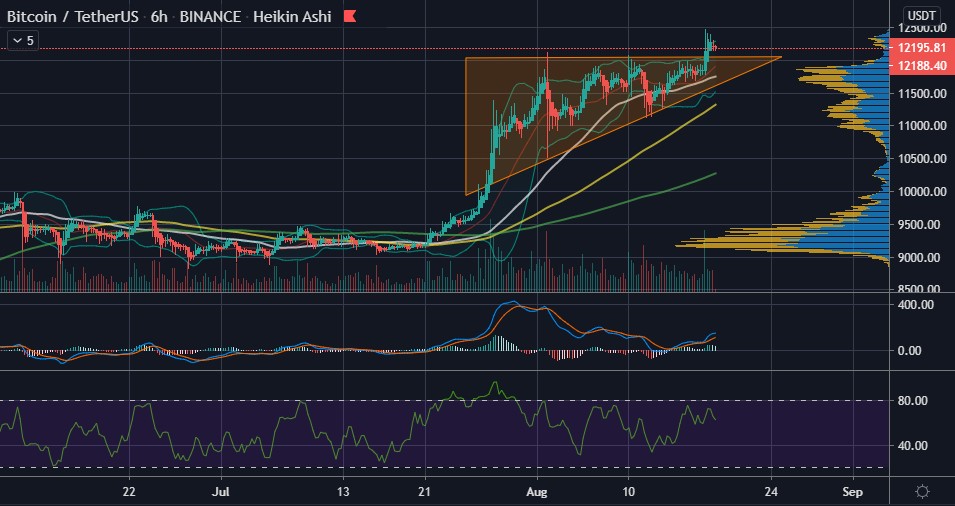
For a better feel of Bitcoin’s price movement, the 6-hour BTC/USDT chart below will be used to provide clues as to what the future holds for BTC.
From the chart, the following can be observed.
- As explained by Mr. Bollinger, Bitcoin’s rally above $12k was picture perfect.
- BTC broke the ascending wedge as anticipated.
- Bitcoin’s current price at $12,200 is above the 50, 100, and 200 moving averages confirming a bullish environment.
- However, the 6-hour MACD and MFI point towards some exhaustion for Bitcoin on the 6-hour chart.
- Trade volume is also in the red highting of a possible dip to the $12k area to test this area as support.
However, zooming out to the daily MACD, it is observed that it is about to cross in a bullish manner hinting that BTC could be gearing up for another move to retest its recent peak of $12,500. If the $12,500 resistance area is broken, Bitcoin could well be on a path to retest the $13,000 area.
As with all analyses of Bitcoin, traders and investors are advised to use stop losses and low leverage when trading on the various derivatives platforms.
Original article posted on the EthereumWorldNews.com site, by John P. Njui.
Article re-posted on Markethive by Jeffrey Sloe
Visit MarketHive to learn more: http://markethive.com/jeffreysloe


