Bitcoin Sees Best Q1 Performance Since 2013

Bitcoin Sees Best Q1 Performance Since 2013 – What To Expect In The Near Term
By Olivia Brooke – April 3, 2021

The month of April is extremely promising for Bitcoin. The benchmark cryptocurrency has surged 101% in the first quarter of the year, proving that the bull market has impacted the asset in many ways.
Bitcoin takes on $60,000
Historically, Bitcoin has had the best 1st quarter performance since 2013. According to data provided by BLOQPORT, Bitcoin has been in the green for six consecutive months. The last time the market was in this state was as far back as 2013 when the same pattern repeated itself.

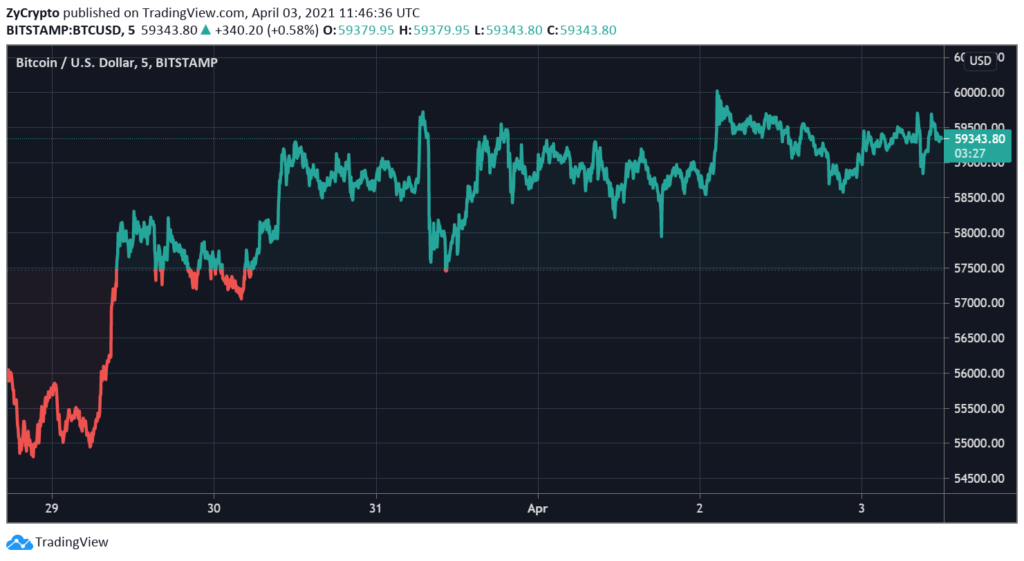
BTCUSD Chart By TradingView (Click image for larger view)
Going further, Bitcoin has managed to stay above $50,000 for the past 30 days. This is an incredible step up for the asset which had only recently attained that price in February. Seeing bitcoin below $50,000 is becoming less possible, according to analysts’ speculation, this will filter the number of people who can afford to buy a single Bitcoin.
Following the announcement of Goldman Sachs offering Bitcoin to its wealthy clients after years of rejecting the asset, bitcoin hit 3% and has continued moving in green since the news surfaced. At press time price of $59,804, buying pressure seems to have been halted for a while, as Bitcoin has stayed stagnant at that price range for the past 12 hours.
It’s a crucial point for Bitcoin from here on out, as failure to remain above $59,000 could increase the time frame it will take the asset to go above $60,000 again. Regardless, the month of April remains highly bullish for Bitcoin.
On-Chain signals are just as bullish
While our previous report noted that the current bull market is largely different from the bull market that took off in 2017, some notable similarities in market movement captured by Glassnode imply that the “HODL Ratio suggests we are at the equivalent of ~$3k-$4k in 2017.” The analyst who observed this is confident that the present Bitcoin bull run “still has a ways to go.”
Similarly, the chart suggests that PEAK HODL (“where the volume of 1yr+ supply hits a maximum, often near the last cycle ATH”) is approaching. According to On-chain analyst Willy Woo, this purports that with every bull market, holding continues to get stronger.
A much bigger opportunity for the bull market to take off? Willy Woo believes so, adding that “the target HODL levels, very much like the price chart on the log scale (climb tapers off), we’ll prob top out in the low to mid-40s; lots more bull market to come.”
DISCLAIMER
The views expressed in the article are wholly those of the author and do not represent those of, nor should they be attributed to, ZyCrypto. This article is not meant to give financial advice. Please carry out your own research before investing in any of the various cryptocurrencies available.
The original article written by Olivia Brooke and posted on ZyCrypto.com.
Article reposted on Markethive by Jeffrey Sloe
Visit MarketHive to learn more: http://markethive.com/jeffreysloe

