Bitcoin Prints Massive Buy Signal Suggesting Price Will Soon Retake 10000

Bitcoin Prints Massive Buy Signal, Suggesting Price Will Soon Retake $10,000

Bitcoin (BTC) has been on a near relentless rally over the past few weeks, bounding past key price points in the $7,000s, then $8,000s, then most recently in the $9,000s. The cryptocurrency, while already up 50% in the past 45 to 50 days, still has more upside, per some prominent analysts, citing a flurry of technical factors that suggest more upside is imminent.
Bitcoin Prints Key Bullish Signal
Bitcoin’s strong rally over the past few weeks have allowed the cryptocurrency to print a flurry of positive signals on its charts.
Most recently, as pointed out by popular TradingView analyst TradingShot, the Ichimoku Cloud — a multi-faceted indicator that lets analysts determine market trends and key price points — just gave the “strongest BULL SIGNAL possible” on the daily chart for Bitcoin.
They wrote in the TradingView point that the last time the Cloud twisted bullish was in April 2019, which was prior to the over 200% rally that took Bitcoin from the $4,000s to $14,000 in a few months’ time in a parabolic fashion.
They added that with Bitcoin bouncing off the 1,000-day moving average in December 2019, that drop was likely the “bottom of the June correction,” noting that the prices around the moving average are a region where BTC classically bottomed in previous bear markets.
TradingShot’s observation of a bullish Ichimoku cross isn’t the only thing that has traders excited for the prospects of Bitcoin in the coming months.
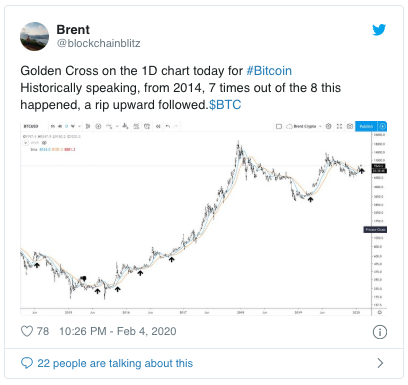
Cryptocurrency trader Brent or Blockchainblitz recently noted that Bitcoin’s daily chart just registered a key technical signal: the 50-day moving average just today crossed above the 100-day moving average, creating a bull cross formation.
He notes that in the past eight times this technical signal was seen since 2014, a “rip upward followed.”
Indeed, our own analysis of this specific moving average cross found that this last took place when BTC was at $5,800 in early-2019, and preceded a 140% move higher. There are also the other historical instances Brent pointed to in his chart.
This confluence suggests that more upside is likely, though it is important to note short-term pullbacks can be sustained by the market to make sure that Bitcoin is not overextended.
Original article posted on the EthereumWorldNews.com site, by Nick Chong.
Article re-posted on Markethive by Jeffrey Sloe
Visit MarketHive to learn more: http://markethive.com/jeffreysloe


